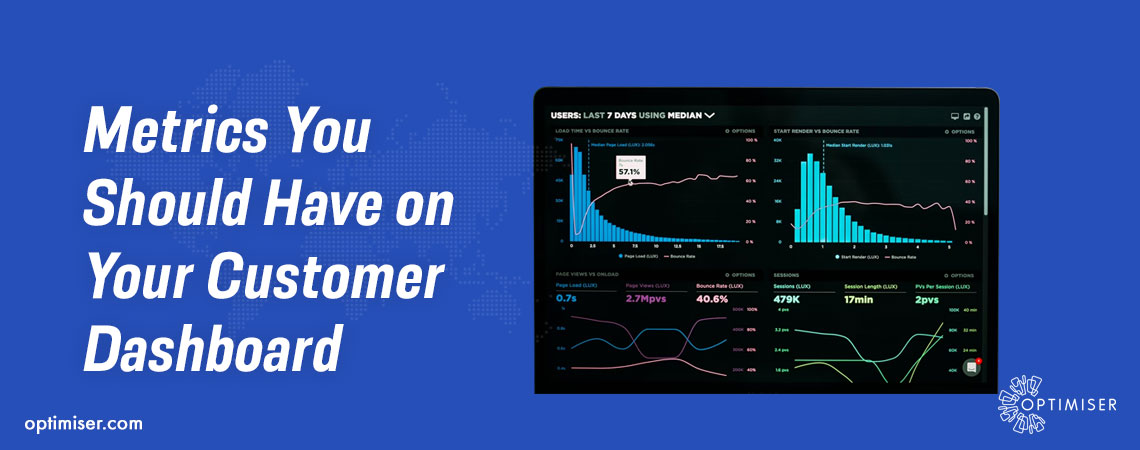
Metrics You Should Have on Your Customer Dashboard
With the help of Dashboard, you will be able to analyse and share data with your customers, service and support teams as well as other departments you need to collaborate with. These actionable insights will go a long way in improving the customer service experience that you offer and allow you to evolve your existing customer strategies, all the while improving the retention rate.
Optimiser Dashboard offers an in-depth glance into complex information with trends, graphs and tables.
Optimiser allows you to customise your dashboards to display the desired KPIs. You can view, organise and analyse as well as share this data with the concerned parties.
However, when discussing Customer metrics, which are the most important ones that should be displayed on the dashboard and will drive the decision-making process.
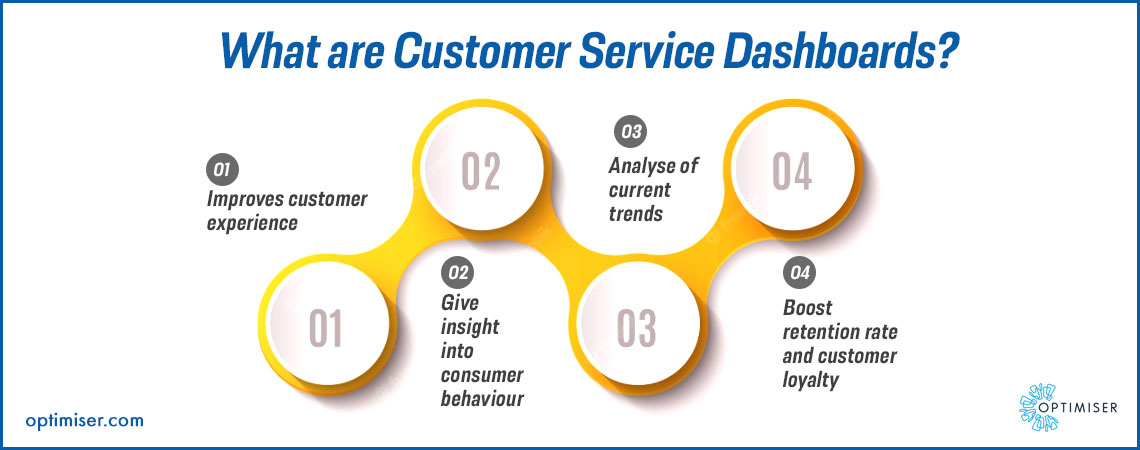
What are Customer Service Dashboards?
These dashboards are used to improve the customer experience. The customer service dashboard offers insight into the behaviour of the consumers and the current trends that are popular amongst the customers. This support will provide you with the opportunity to elevate the level of your customer support teams and improve customer loyalty.
While a number of software offer Dashboard features, Optimiser CRM has its unique features that include customisation, breakdown of complex information into comprehensive charts and graphs as well as tracking of team activities.
Customer Dashboard Metrics
While every organisation has different requirements from a customer service dashboard, here are some of the most common metrics that are displayed by most organisations on their customer service dashboards:
First Contact Resolution Rate
The first metric to have on your customer service dashboard is the First contact resolution rate. This is the percentage at which the service team resolves customer issues when they are at the first point of contact, regardless of the channel used for communication, be it phones, live chatting, emails, etc.
First Call Resolution Rate
This is the percentage at which the service team resolved the customer issues when the first phone call was made.
Ticket Volume
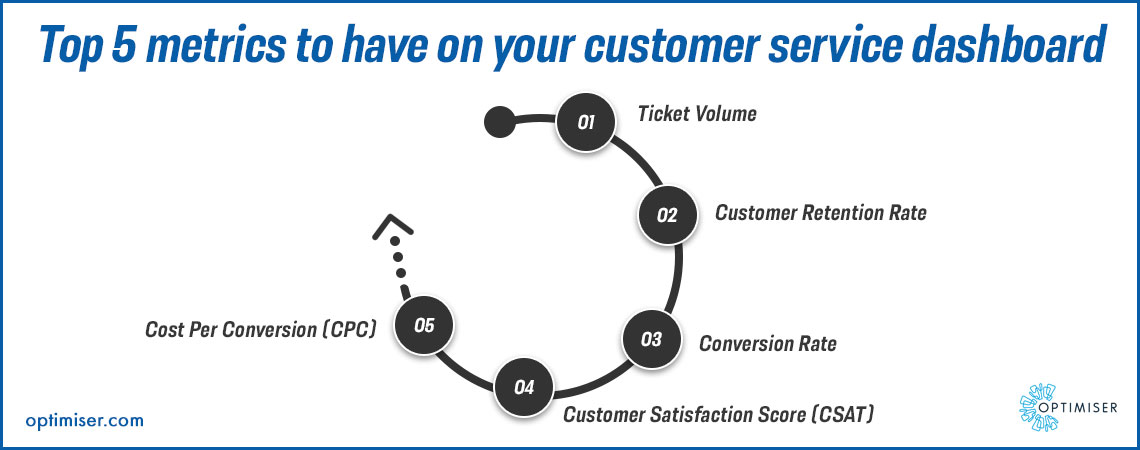
Another important metric, Ticket Volume is the number of tickets that are currently open over a period of time by your support team. This will ensure that you are aware of the queries and do not overlook any of them.
Average Reply Time
This is the average amount of time taken by a service rep to reply to the customers who are reaching out for support.
Average Resolution Time
As the name suggests, the average time taken to resolve the customer tickets is from the time it has been opened.
This metric can highlight what your weakness might be and how you can strengthen your current strategies.
Also Read: How can Technology Help with Evolving Guest Expectations?
Net Promoter Score (NPS)
The net promoter score is the metric that measures how likely the customers are to promote your business to their acquaintances.
Customer Retention Rate (CRR)
Customer retention rate is an important metric for any organisation of any size or type from any industry. This is the percentage of how many customers you will be able to retain. Meaning, what is the percentage of customers who are likely to purchase your products again.
Conversion Rate
The conversion rate is the percentage of website visitors, out of the total number of visitors, who complete the action you desire from them. For example: Making a purchase, booking an appointment, signing up for email newsletters etc.
Customer Effort Score (CES)
Customer effort score is where the customers rank their experiences on a seven-point scale that ranges from 'Very Difficult' to 'Very Easy'. The customer effort score will give you a glimpse into the work that is required to use the product and if it is the efficient solution that the customers are looking for. Furthermore, it can allow you to aim for the improvement of your products/ services.
Customer Satisfaction Score (CSAT)
The customer satisfaction score is the level of satisfaction that a customer gets after purchasing your product, a conversation or any interaction with the organisation. Usually, it is calculated with the help of the question, "Was your experience satisfying?" and "How happy are you with your experience with our business?"
Adding to the latter is a survey scale that will help a business gauge the customer experience. The scale ranges from 1-3, 1-5, or 1-10.
Cost Per Conversion (CPC)
Cost per conversion is significant for every business as it calculates how much it costs the business to acquire a new customer. It is also known as cost per action.
Summary
Optimiser CRM allows you to manage all your contacts with ease and on one platform. The CRM comes with intelligent AI-enabled automation that is efficient and intuitive. Any and every interaction with the contacts will be updated in the database and will be backed up automatically. Optimiser CRM comes with cloud storage and a two-step authentication factor that ensures that the company's data remains secure from hackers.
The Dashboard feature of the CRM can be customised to suit individual needs and display information that you want. It makes it that much easier to process complex data and the consolidation of data allows anyone to understand the performance of the company.
By creating the customer service dashboard, your organisation can offer a highly personalised experience to the customers as well as persuade leads to purchase your products with your customer service and customisation. The flexibility offered by the platform allows you to be flexible as well.

30 days free trial. No credit card required
 One powerful platform
 Simple to use
 Comprehensive

